3. Cultural Occupations
This chapter presents a high-level quantitative perspective on the composition, size, and growth of the cultural sector using the unit of measurement “employment in cultural occupations,” which resonate best with how most stakeholders see the sector. While cultural occupations are undeniably linked in concept to the framework Statistics Canada uses to define the sector, the actual employment values are distinct between the two perspectives. For more personal and granular details about the employment aspects of working in cultural occupations, refer to Chapter 7: Cultural Sector Consultations.
Unlike the majority of employment settings found in Canada—where employees work for a single employer, typically in a full-time, year-round capacity with statutory benefits and entitlements—a prominent characteristic of work in the cultural sector is the high incidence of self-employment. Indeed, data from Statistics Canada’s 2016 Census suggests that nearly 28 per cent of the employment in cultural occupations is self-employment—more than twice the national level (12 per cent). Given the higher percentage of part-time, temporary, and contract working arrangements that are common in the cultural sector, many workers face tremendous uncertainty over employment, hours, earnings, and benefits.
Indeed, many of those working in the cultural sector are in non-traditional employment categories, such as “own-account” self-employed (a self-employed person with no paid employees) or self-employed employer (a self-employed person with paid employees). Rather than holding full-time positions, many are part-time, temporary, or contract employees. In addition, given the higher incidence of non-traditional employment in the sector, many are multiple job holders, with two or more concurrent jobs.
This chapter presents a profile of employment in the cultural labour force, using the latest census data from Statistics Canada. This profile focuses on cultural occupations, rather than cultural establishments, in order to capture those individuals employed in the cultural sector who do not work for cultural establishments. The analysis includes those who work in cultural sector establishments as employees and those who are self-employed.
Please see Appendix B for a full list of the occupations.
3.1 Employment Profile of Cultural Occupations
3.1.1 Employment Overview
There were 798,305 individuals working in a cultural occupation in Canada in 2015, which represented 4 per cent of the overall Canadian labour force. The creative and artistic production occupations accounted for more than a half of the cultural labour force (53 per cent). Technical and operational occupations made up another 41 per cent. Heritage collection and preservation combined with cultural management occupations made up the remaining 6 per cent.
Chart 3.1.1 Employment Growth, 2010–2015
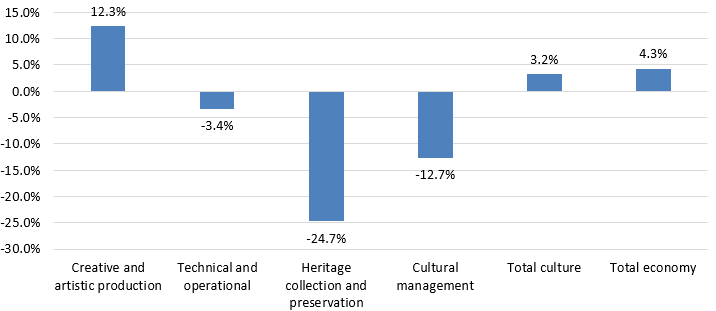
Based on Statistics Canada’s census data from 2011 and 2016, employment in cultural occupations increased by 3.2 per cent between 2010 and 2015, slightly less than the 4.3 per cent employment growth in the overall economy over the same time span. The creative and artistic production occupations experienced by far the strongest growth, expanding at almost three times the pace of the overall cultural sector. On the flip side, employment in the other three occupational groups declined over the five-year period, with heritage collection and preservation occupations experiencing the biggest drop. A full breakdown of growth for all cultural occupations can be found in Appendix B. The estimates of cultural labour force in this chapter differ from those presented in Statistics Canada’s Culture Satellite Account. The focus of the Culture Satellite Account framework is on cultural products or cultural industries, and therefore the data do not align precisely with cultural occupations. In addition, the figures in the Culture Satellite Account represent the number of full-year equivalent jobs—whereby seasonal jobs only account for the portion of the year they represent.
Source: Statistics Canada, 2011 Census and 2016 Census.
Table 3.1.1: Employment in Cultural Occupations, 2010–2015
|
Cultural occupations |
2010 |
2011e |
2012e |
2013e |
2014e |
2015 |
|
Creative and artistic production |
379,815 |
388,752 |
397,898 |
407,260 |
416,842 |
426,650 |
|
Heritage collection and preservation |
25,925 |
24,492 |
23,138 |
21,860 |
20,651 |
19,510 |
|
Cultural management |
32,359 |
31,490 |
30,644 |
29,821 |
29,020 |
28,240 |
|
Technical and operational |
335,372 |
333,047 |
330,737 |
328,444 |
326,167 |
323,905 |
|
Total cultural occupations |
773,472 |
777,781 |
782,418 |
787,385 |
792,680 |
798,305 |
Source: Statistics Canada, 2011 Census and 2016 Census.
e = estimate
3.1.2 Gender Distribution of Cultural Labour Force
According to Statistics Canada’s most recent (2016) census, the overall cultural labour force in Canada is nearly equally split between male and female workers. While most of the occupational groups tend to be represented by a higher share of female workers, the technical and operational occupation group is represented by a higher share of male workers.
Table 3.1.2: Gender Distribution of Cultural Occupations, 2015
|
Cultural occupations |
2015 |
Male % |
Female % |
|
|
Creative and artistic production |
426,650 |
48.7% |
51.3% |
|
|
Heritage collection and preservation |
19,510 |
37.0% |
63.0% |
|
|
Cultural management |
28,240 |
48.0% |
52.0% |
|
|
Technical and operational |
323,905 |
51.4% |
48.6% |
|
|
Total cultural occupations |
798,305 |
49.5% |
50.5% |
|
Source: Statistics Canada, 2016 Census.
3.1.3 Regional Distribution of Cultural Labour Force
The census data show that in 2015, the majority of the employed cultural labour force in Canada was located in Ontario and Quebec, with the two provinces accounting for 65 per cent of the total cultural labour force in Canada that year. Meanwhile, the Prairies and B.C. accounted for close to 30 per cent of the total employed cultural labour force, while the remaining 5 per cent were in Atlantic Canada (Newfoundland and Labrador, Prince Edward Island, Nova Scotia, and New Brunswick) and the territories.
Chart 3.1.3 Regional Distribution of Cultural Labour Force, 2015
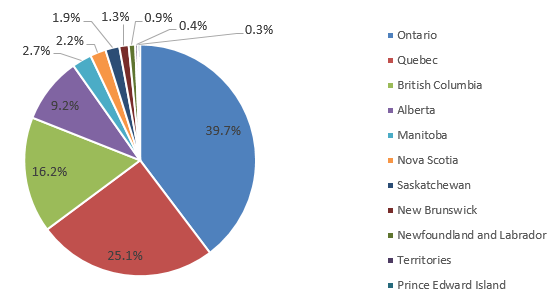
Source: Statistics Canada, 2016 Census.
3.2 Demographic Profile of the Cultural Sector Labour Force
3.2.1 Age Profile
Overall, cultural workers are younger on average than the overall Canadian labour force. Nearly 59 per cent of cultural workers are 44 years of age or younger, compared with 55 per cent among all workers. Cultural workers are older, however, than they were five years ago, when almost 62 per cent were 44 years old or younger.
Since the census captures only a worker’s primary occupation, it is likely that workers in certain age groups may be underrepresented in the cultural sector. Indeed, it is not uncommon for younger cultural workers to work elsewhere (for financial reasons) before they can establish themselves in the cultural sector. Consequently, their involvement in the cultural sector will not be captured by the census.
Among the cultural occupational groups, creative and artistic production occupations have the widest range in ages among workers. For example, more than 60 per cent of dancers are 34 years or younger, whereas more than a third of painters, sculptors, and other visual artists are over the age of 55. Meanwhile, in heritage collection and preservation occupations, close to half of the employees are 45 years and older.
Chart 3.2.1 Age Profile in the Cultural Sector, 2015
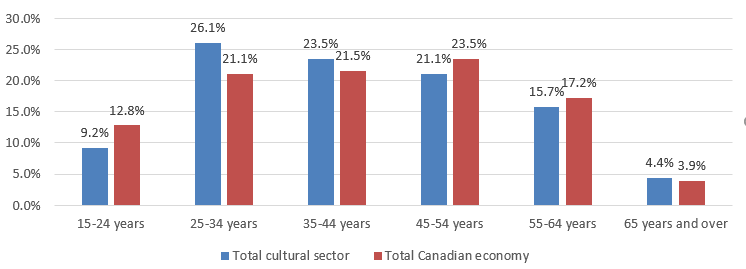
Source: Statistics Canada, 2016 Census.
The age profiles of the rest of the cultural occupational groups (cultural management, technical and operational) were broadly similar to that of the overall Canadian labour force.
3.2.2 Immigration and Visible Minority Status
Immigrant and visible minority workers[1]are somewhat under-represented among cultural workers. Among the four occupational groups, heritage collection and preservation occupations have the lowest share of immigrant and visible minority workers. (See Chart 3.2.2).
Chart 3.2.2 Immigration and Visible Minority Status, 2015
(as a share of total workers)
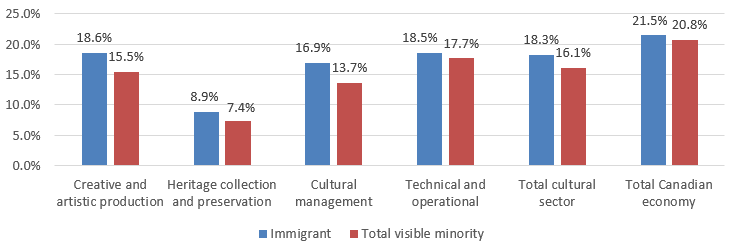
Source: Statistics Canada, 2016 Census.
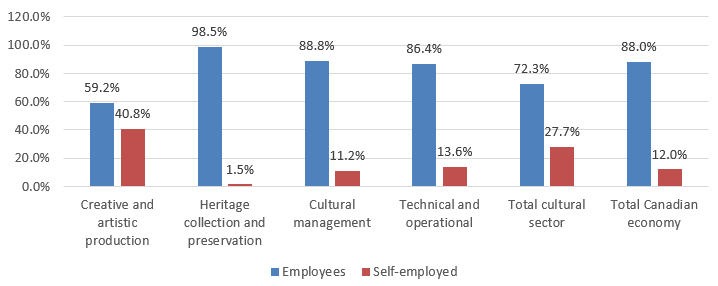
3.2.3. Employment Status
Self-employment is a common characteristic of the working lives of many cultural workers in Canada. In fact, almost 41 per cent of workers with creative and artistic production occupations are self-employed. Overall, the share of self-employed workers in the cultural sector (28 per cent) is more than double the rate of all Canadian workers (12 per cent).
In contrast, the incidence of self-employment among heritage and preservation workers is significantly lower than in the overall Canadian workforce, at only 1.5 per cent. Meanwhile, the share of self-employed workers in cultural management and in technical and operational occupations is similar to that of the overall employed Canadian labour force (11 and 14 per cent). (See Chart 3.2.3.1a.)
Chart 3.2.3.1a Employment Status: Employees vs. Self-Employed by Occupational Group, 2015
Source: Statistics Canada, 2016 Census.
Chart 3.2.3.1b Employment Status: Employees vs. Self-Employed by Cultural Domain, 2015
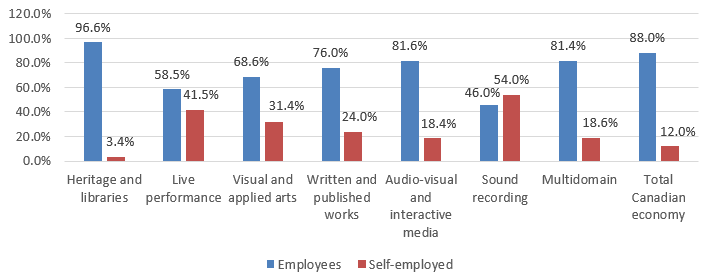
Source: Statistics Canada, 2016 Census.
An interesting pattern emerges when looking at the data from a cultural domain perspective. More than one-half of the workers in sound recording are self-employed (54 per cent). Almost 42 per cent of workers in live performance, a domain that is traditionally characterized by working on a as-needed (by gig) basis, are self-employed.
The share of part-time versus full-time employment in cultural occupations is similar to that of the overall Canadian labour force. Among cultural workers, 13 per cent of employment is part-time, namely working less than 30 hours per week. Part-time employment appears to be more common among occupations with higher rates of self-employment, such as those that fall within creative and artistic occupations. However, it should be noted that the work activity is classified only based on paid hours: it does not include the unpaid hours spent on training, practice, and preparation, arguably an integral part of earning a living in the cultural sector. As a result, in the case of cultural workers, the share of full-time employment could potentially be underestimated, as these unpaid hours are not considered. Meanwhile, perhaps not surprisingly, most of the employment in cultural management occupations (90 per cent) is full-time.
Chart 3.2.3.2 Employment Status: Part-Time vs. Full-Time, 2015
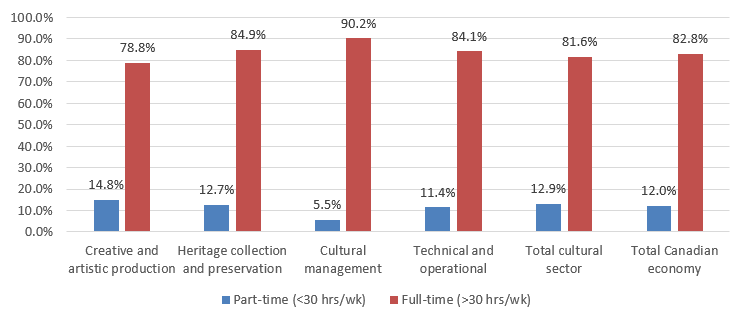
Source: Statistics Canada, 2016 Census.
Note: The share of workers with no hours worked is not included.
3.2.4 Education Profile
Another defining feature of the cultural workers is their high level of educational attainments: 43 per cent of cultural workers hold a bachelor’s degree or higher, compared with 25 per cent in the overall labour force. On the lower end of the education spectrum, the percentage of cultural workers without a high school diploma is lower than the percentage of workers in the overall Canadian labour force without a high school diploma (4 per cent of cultural workers vs. 12 per cent of all workers).
Among all cultural occupational groups, heritage collection and preservation occupations register the highest level of education, with close to half of the workers holding master’s degrees or higher (47.2 per cent). This is perhaps not surprising, as significant specialized training is usually required for workers to be qualified for jobs in this category. Another 19 per cent hold bachelor’s degrees, meaning that two-thirds of workers in heritage collection and preservation are university-educated. Meanwhile, 37 per cent of workers in technical and operational occupations hold a bachelor’s degree or higher.
Chart 3.2.4 Education Profile, 2015
(as a share of total workers in each domain)
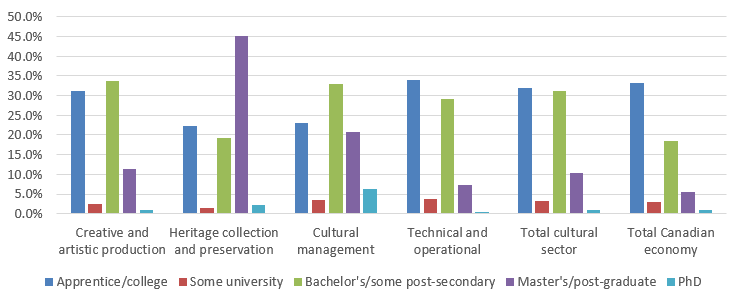
Source: Statistics Canada, 2016 Census.
Note: This share of workers with a high school diploma or less is not included. “PhD” includes all earned doctorates, including, for example, doctorates of musical arts.
3.2.5. Wages and Salaries
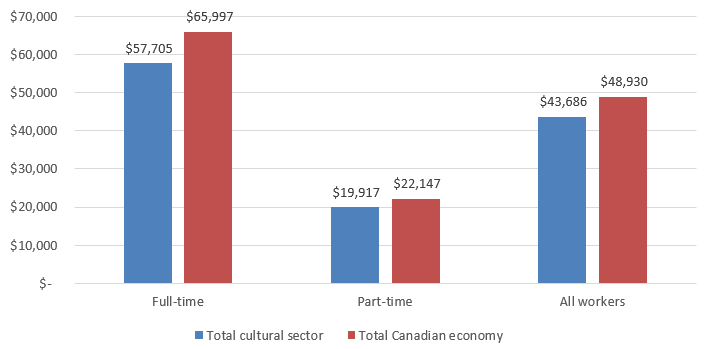
Despite the high levels of education among workers in the cultural labour force, employment income recorded among cultural occupations tends to be lower than for the Canadian labour force overall. This stands true for both full-time and part-time workers. For full-time workers, the average income among cultural occupations was $8,300 lower than it was for the overall labour force in 2015, whereas the difference for part-time workers was $2,230.
Still, the census data do not indicate what portion of a worker’s annual income comes from primary or secondary occupations. For this reason, census data may present a skewed interpretation of average employment income, as the cultural sector features a high percentage of multiple-job holders. Moreover, it is also worth stressing that the income data captured by the census may not depict a full picture of income earned by cultural workers. In particular, many self-employed cultural workers get paid only by piece or for hours spent working. Unpaid hours devoted to preparation and practice—an inseparable part of working in the cultural sector—are not captured by the census. Consequently, cultural workers in many cases earn significantly less per hour than workers in other more conventional occupations if these unpaid hours are included.
Chart 3.2.5.1 Average Employment Income Levels, 2015
Source: Statistics Canada, 2016 Census.
The distribution of incomes within a sector can also be ascertained by looking at the differential between average and median incomes. The average wage is calculated as the sum of all of the annual wages paid in the sector divided by the number of workers in the sector. The median is the midpoint wage in the sector—the wage at which 50 per cent of wages are higher than the median and 50 per cent are lower than the median. A small difference indicates that incomes within the sector are distributed relatively evenly, while a large difference suggests that there are a few people within the sector who have a high income but that the majority have a low wage.
Compared with the Canadian labour force as a whole, cultural workers are characterized by a considerably lower differential between the average and median wage ($5,700 among cultural occupations vs. $12,200 in overall labour force). (See Chart 3.2.5.2.) This suggests that there are fewer cultural occupations with large income disparities. Among cultural occupational groups, the largest differentials between average and median wages are in creative and artistic production occupations and in cultural management occupations.
Chart 3.2.5.2 Income Levels: Average vs. Median, 2015
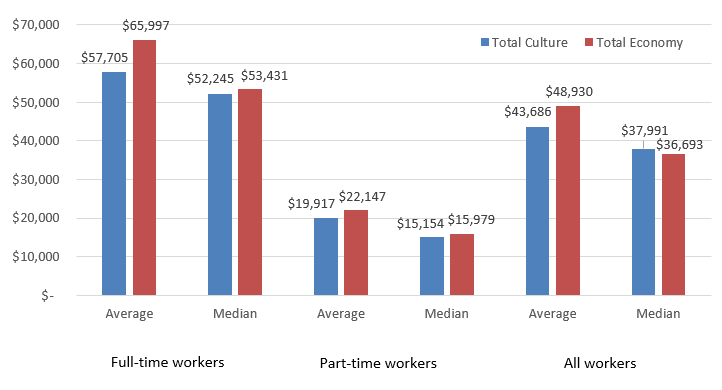
Source: Statistics Canada, 2016 Census.
3.3 Labour Market Performance of Cultural Occupations
This section provides a more detailed analysis of the earnings profile of cultural occupation groups.
3.3.1 Creative and Artistic Production Occupations
|
Indicator |
Creative and artistic production |
Total cultural sector |
Total Canadian economy |
|
Employment |
426,650 |
798,305 |
19,956,255 |
|
Average income |
$37,417 |
$43,686 |
$48,930 |
Source: Statistics Canada, 2016 Census.
Creative and artistic production represents the largest cultural occupation group. It encompassed more than one-half of all cultural workers in 2015 (53 per cent) and includes many of the occupations traditionally associated with culture, such as actors, dancers, writers, and musicians.
Employment growth in creative and artistic production occupations rose 12 per cent between 2010 and 2015, significantly outpacing the 3.2 per cent growth in cultural occupations overall.[2] It should be noted, however, the strong growth coincided with the economic downtown in Canada around that time. Part of the growth therefore likely stemmed from unemployed workers from other sectors joining the cultural sector. Among the occupations that fall within this category, strong growth was recorded for “other performers”—a category that includes circus performers, magicians, models, and puppeteers—(46 per cent), painters, sculptors, and other visual artists (34 per cent), and actors and comedians (27 per cent).
A few occupations saw a decrease in employment during this period: journalists suffered the highest decline (down 12 per cent), and editors registered a 4 per cent drop. The highest-paying occupations in this group were urban and land-use planners, with an average income of $73,935 in 2015, and architects, with income averaged at $72,885. The lowest-paid occupations in this group included dancers, with an average income of $16,005, and musicians and singers, with an average income of $18,734.
A study conducted by the Art Gallery of York University looked at the earnings of professional visual artists in Canada. The study “Waging Culture” found that the typical visual artist made $29,257 from all sources of income in 2012. Non-art-related sources of income are important for visual artists, making up about 27 per cent of their total income, on average. The study estimates that female artists make up 63 per cent of visual artists and work more hours in non-art-related activities than do male artists.[3]
3.3.2 Heritage Collection and Preservation Occupations
|
Indicator |
Heritage collection and preservation |
Total cultural sector |
Total Canadian economy |
|
Employment |
19,510 |
798,305 |
19,956,255 |
|
Average income |
$54,722 |
$43,928 |
$48,930 |
Source: Statistics Canada, 2016 Census.
The heritage collection and preservation occupational group consists of only four occupations: librarians, conservators and curators, archivists, and conservation and fishery officers. It is the smallest of the cultural occupational groups, accounting for only 2.4 per cent of all cultural workers. Between 2010 and 2015, the number of workers employed in this group decreased by almost one-quarter.
A distinctive feature of this group is the high level of educational attainments. Almost one half (47 per cent) of the workers employed in heritage collection and preservation occupations hold a master’s degree or higher. In aggregate, more than two-thirds of the workers in this category are university-educated. Consequently, heritage occupations are characterized by one of the highest average incomes among all cultural occupations in 2015, at $54,722.
A detailed profile of the librarian workforce can be found in 8Rs Redux: CARL Libraries Human Resources Study. The report presents the findings of a study examining the human resource challenges facing Canadian research libraries over the long term. It includes a demographic profile of Canadian research library personnel based on surveys conducted in 2013 and 2014. The study found that 52 per cent of library staff in Canada were librarians with a master of library and informational sciences (MLIS) degree. About 34 per cent were paraprofessionals who were working as library technicians, library assistants, and providers of information technology support. Of those who were librarians, 45 per cent worked in a supervisory or management role, and 79 per cent had been in their career for more than six years. The study also revealed a significant gender disparity among library personnel, as 69 per cent of librarians were female.[4]
3.3.3 Cultural Management Occupations
|
Indicator |
Cultural management |
Total cultural sector |
Total Canadian economy |
|
Employment |
28,240 |
798,305 |
19,956,255 |
|
Average income |
$75,081 |
$43,928 |
$48,930 |
Source: Statistics Canada, 2016 Census.
Similar to the heritage group, the cultural management occupational group consists of only five occupations: library, archive, and art gallery managers; managers in publishing, motion pictures, broadcasting, and live performing arts; supervisors of library, correspondence, and related clerks; architecture and science managers; and senior managers in broadcasting. This occupational group accounts for 3.5 per cent of all cultural employment. Overall employment in this group decreased by almost 13 per cent between 2010 and 2015.
As all the workers in this occupational group are at management level in their respective cultural establishments, they have the highest average income among all occupational groups. In 2015, workers in cultural management occupations had an average income of $75,081. It should be noted, however, this occupational group consists of workers in both for-profit and not-for-profit organizations. Jobs in for-profit institutions generally come with much higher compensation, and this results in a high average income.
The 2017 National Compensation Study for Management and Administration Positions in Not-for-Profit Arts Organizations found that cultural management positions in arts organizations continue to lag other not-for-profit and private sectors in many areas of compensation and benefits. Thus, while the level of compensation may be high relative to other cultural occupations, it falls short relative to that of the economy as a whole. Staff turnover, limited career advancement opportunities, and inadequate succession planning are key challenges for attracting and retaining managers.[5]
3.3.4 Technical and Operational Occupations
|
Indicator |
Technical and operational |
Total cultural sector |
Total Canadian economy |
|
Employment |
323,905 |
798,305 |
19,956,255 |
|
Average income |
$42,144 |
$43,928 |
$48,930 |
Source: Statistics Canada, 2016 Census.
Technical and operational occupations make up the second largest cultural occupational group, at 41 per cent of cultural workers. Employment in technical and operational occupations fell by 3.4 per cent between 2010 and 2015. Photographic and film processors suffered the biggest drop (down 54 per cent), predictably due to the filmmaking industry entering the digital era. In addition, many printing-related occupations witnessed a considerable slide in employment, such as printing machine operators (down 42 per cent) and binding and finishing machine operators (down 40 per cent). Conversely, many occupations experienced double-digit increases, including other technical support and co-ordinating occupations in motion pictures, broadcasting, and the performing arts (up 41 per cent). Support occupations in motion pictures, broadcasting, and the performing arts came a close second, gaining 39 per cent over the five-year period.
[1] The Employment Equity Act defines visible minorities as “persons, other than Aboriginal peoples, who are non-Caucasian in race or non-white in colour.”
[2] Statistics Canada, 2011 and 2016 Census.
[3] Maranda, “Waging Culture 2012.”
[4] Delong, 8Rs Redux, CARL Libraries Human Resources Study.
[5] CHRC and Mercer (Canada), 2017 National Compensation Study for Managerial and Administrative Positions in Not-for-Profit Arts Organizations.